Monitoring in IoT Systems
Visualizing data is key in IoT systems. In most cases, data need to be presented in a modern, flexible, configurable and feature-rich environment. They are critical for not just observability and monitoring, but also to track and fix system health issues and resource bottlenecks.

Expected functionality from a monitoring system
- Dashboarding
- Alerts
- KPI
- Filtering
- Tresholding
- Statistics
At BE., we try, when possible, to work with open source solutions. Fortunately, there are excellent options to monitor data streams like Grafana or Promotheus.
Grafana
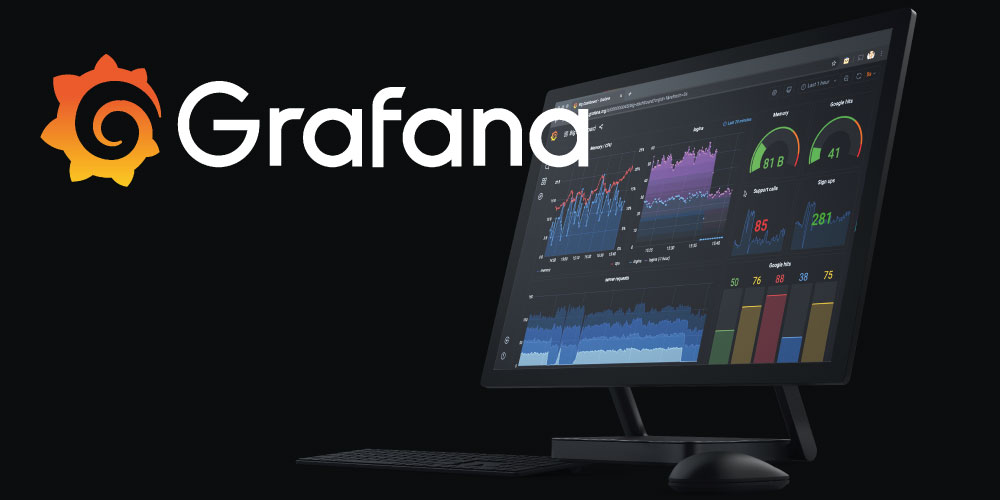
Grafana, which runs as a web application, is used by small to large enterprises to monitor visualizations and manage reports on metrics, logs and alerts. It offers integration with a rich set of data sources out of the box. Grafana also provides a huge list of community -- and Grafana Labs -- supported panel plugins that enable users to create visualizations with options such as world maps, heat maps and pie, bar and line charts.
Grafana

Prometheus
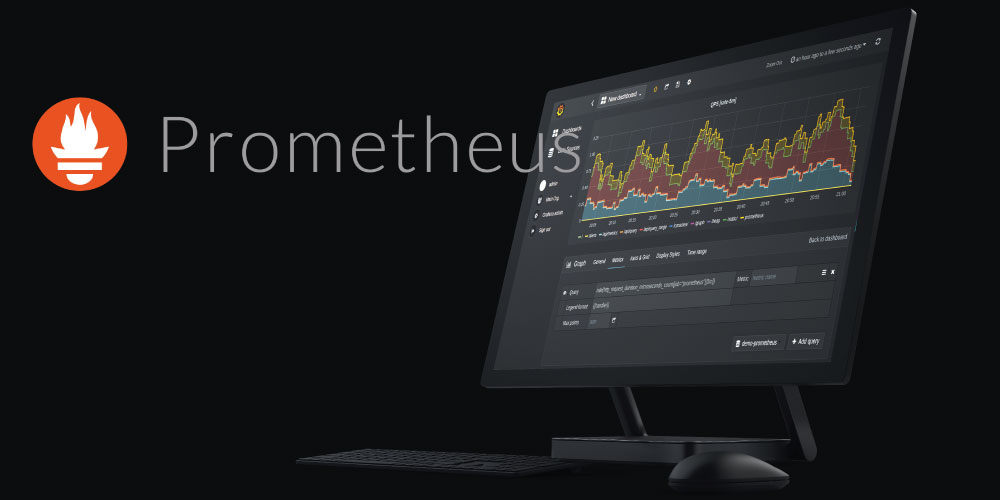
Prometheus is also an open source application for monitoring and alerting, as well as a time- series database. It is an independent project on GitHub, developed actively by the open source community. Prometheus records real-time series metrics via the HTTP pull method in a time-series database. It also provides a multidimensional data model and a flexible query language.
Promotheus

Feature-rich visualization with Grafana and Prometheus
Note that Grafana and Prometheus can be used together, bringing the synergy of high-end metric collection and feature-rich visualizations.

